Getting started
Rob Challen
03/01/2022
getting-started.Rmdgrowth rate estimate + rt from growth rate
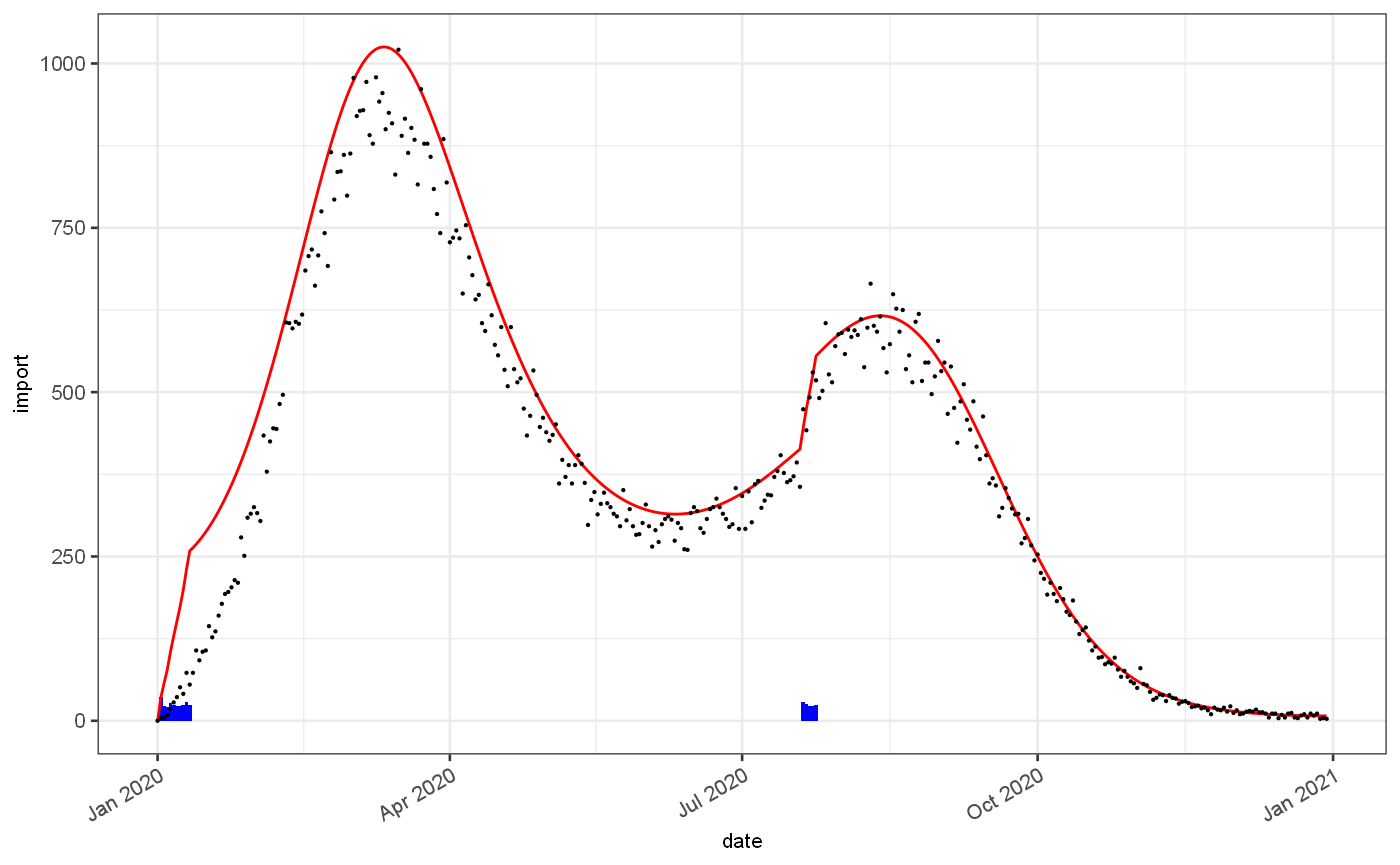
test = jepidemic::vignetteDataset$ts  %>% filter(bootstrap==2, observationDate==max(observationDate))
infProf = jepidemic::vignetteDataset$infectivityProfile

ggplot(test)+
  geom_bar(mapping=aes(x=date,y=import), stat="identity",fill="blue")+
  geom_line(mapping=aes(x=date,y=Est.actual), colour="red")+
  geom_point(mapping=aes(x=date,y=value), size=0.1, colour="black")
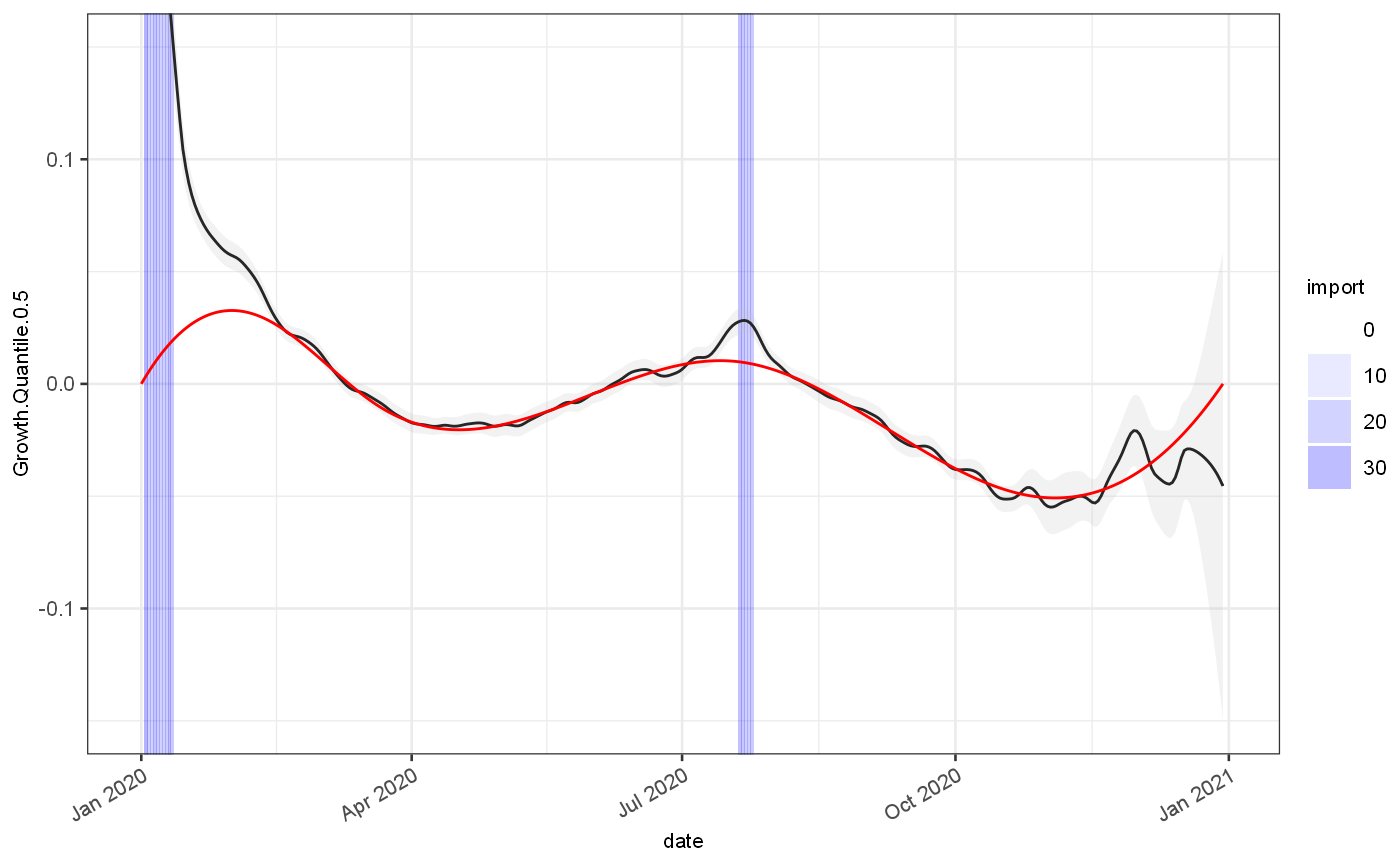
gr = test %>% locfitGrowthEstimate()
## Registered S3 method overwritten by 'quantmod':
##   method            from
##   as.zoo.data.frame zoo

ggplot(gr)+
  geom_rect(aes(xmin=date,xmax=date+1,alpha=import),ymin=-Inf,ymax=Inf,fill="blue")+
  scale_alpha_continuous(range=c(0,0.3))+
  geom_line(aes(x=date,y=Growth.Quantile.0.5), colour="black")+
  geom_ribbon(aes(x=date,ymin=Growth.Quantile.0.025,ymax=Growth.Quantile.0.975), fill="grey",alpha=0.2)+
  geom_line(aes(x=date,y=Growth.actual), colour="red")+
  coord_cartesian(ylim=c(-0.15,0.15))
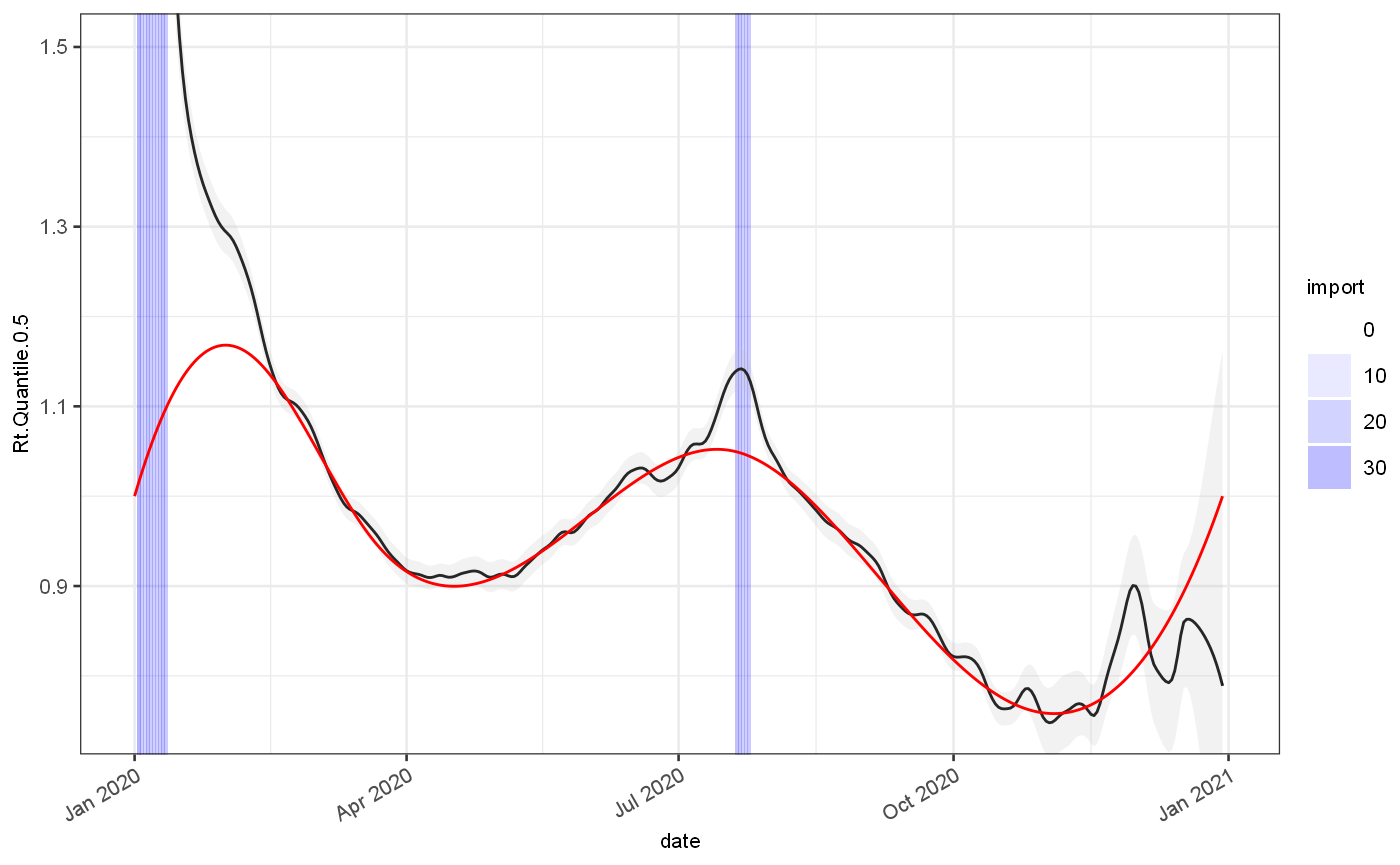
rt = gr %>% rtFromGrowthRate(infProf)

ggplot(rt)+
  geom_rect(aes(xmin=date,xmax=date+1,alpha=import),ymin=-Inf,ymax=Inf,fill="blue")+
  scale_alpha_continuous(range=c(0,0.3))+
  geom_line(aes(x=date,y=Rt.Quantile.0.5), colour="black")+
  geom_ribbon(aes(x=date,ymin=Rt.Quantile.0.025,ymax=Rt.Quantile.0.975), fill="grey",alpha=0.2)+
  geom_line(aes(x=date,y=Rt.actual), colour="red")+
  coord_cartesian(ylim=c(0.75,1.5))
 # Rt via cori method:
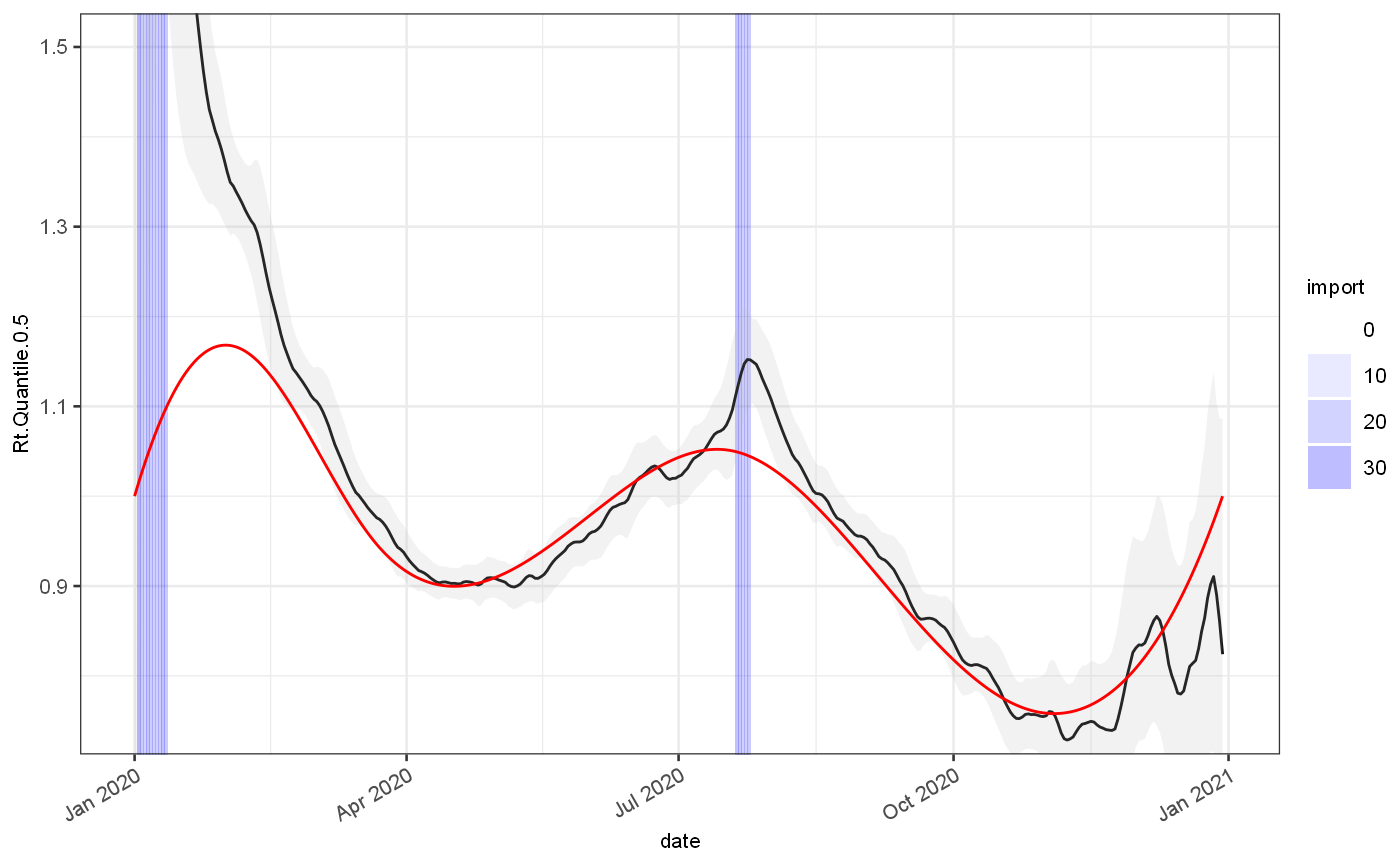
estim1 = J$CoriEstimator$new(r0Mean = 1.2,r0SD = 4,maxWindow = 14)
estim1$withInfectivityProfileMatrix(infProf$yMatrix)
estim1$inMiddleOfTimeseries()
estim1$withAdaptivePrior(factor = 1.25)
estim1$selectMixtureCombination()
estim1$collectMixtureApproximation()
cori = estim1$estimateRt(test, dateColName = "date",incidenceColName = "value") %>% mutate(date = Rt.EndDate)


ggplot(cori)+
  geom_rect(data=test, mapping=aes(xmin=date,xmax=date+1,alpha=import),ymin=-Inf,ymax=Inf,fill="blue")+
  scale_alpha_continuous(range=c(0,0.3))+
  geom_line(aes(x=date,y=Rt.Quantile.0.5), colour="black")+
  geom_ribbon(aes(x=date,ymin=Rt.Quantile.0.025,ymax=Rt.Quantile.0.975), fill="grey",alpha=0.2)+
  geom_line(data=test, mapping=aes(x=date,y=Rt.actual), colour="red")+
  coord_cartesian(ylim=c(0.75,1.5))
 # Bayesian estimators
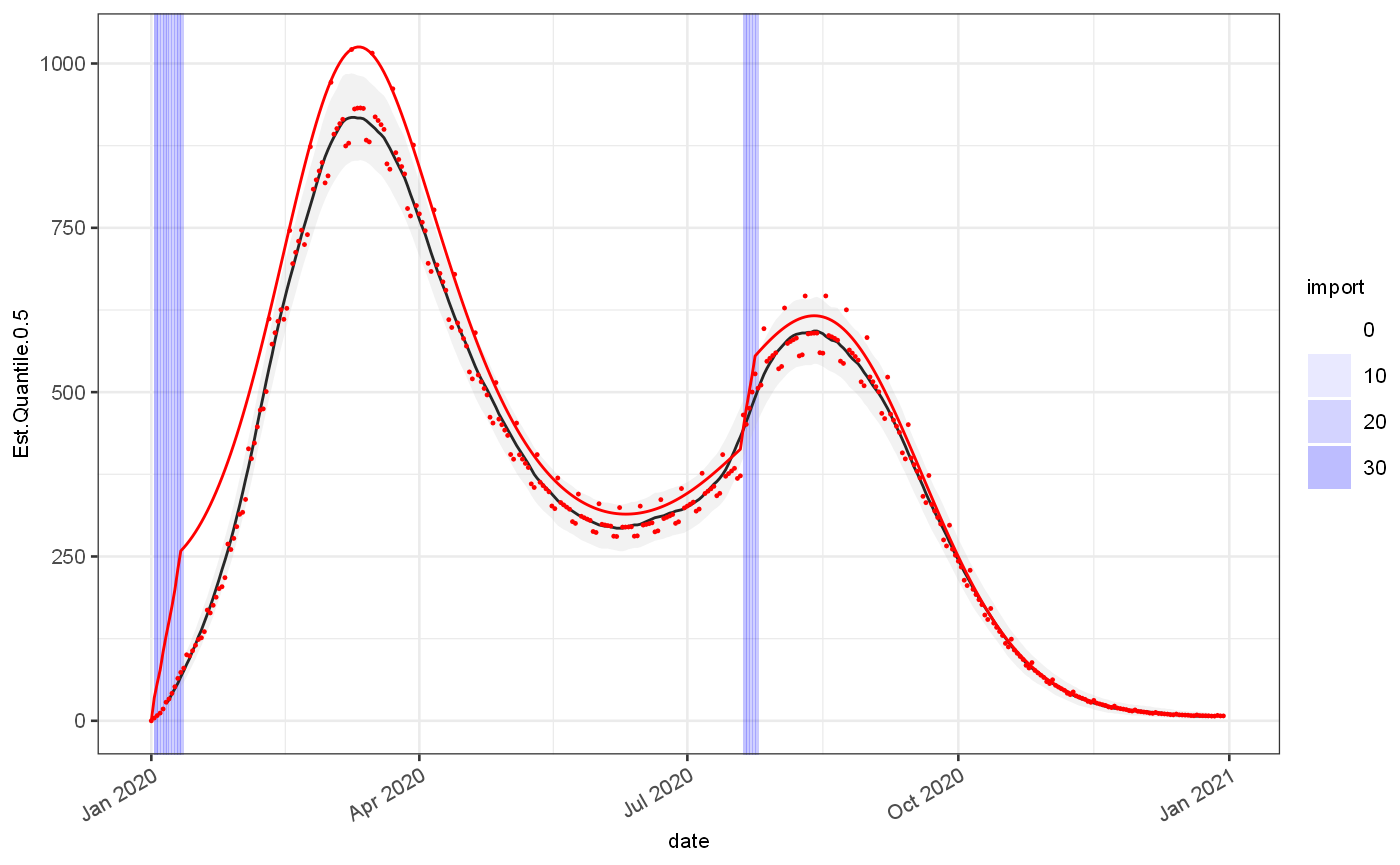
grEstim = J$GrowthRateEstimator$new(minWindow = 4,maxWindow = 21)
# grEstim$priorIncidenceFromPosteriorMean()
# grEstim$combineEstimatesWithWeightedMixture()
# grEstim$useAllPosteriorEstimates()
grEstim$withSaneDefaults()
grEstim$withInfectivityProfileMatrix(infProf$yMatrix)
out = grEstim$estimateGrowthRateSingle(test, dateColName = "date",incidenceColName = "value")

ggplot(out)+
  geom_rect(data=test, mapping=aes(xmin=date,xmax=date+1,alpha=import),ymin=-Inf,ymax=Inf,fill="blue")+
  scale_alpha_continuous(range=c(0,0.3))+
  geom_line(aes(x=date,y=Est.Quantile.0.5), colour="black")+
  geom_ribbon(aes(x=date,ymin=Est.Quantile.0.025,ymax=Est.Quantile.0.975), fill="grey",alpha=0.2)+
  geom_line(data=test, mapping=aes(x=date,y=Est.actual), colour="red")+
  geom_point(data=test, mapping=aes(x=date,y=Est.observed), colour="red",size=0.2)
## Warning: Removed 10 row(s) containing missing values (geom_path).
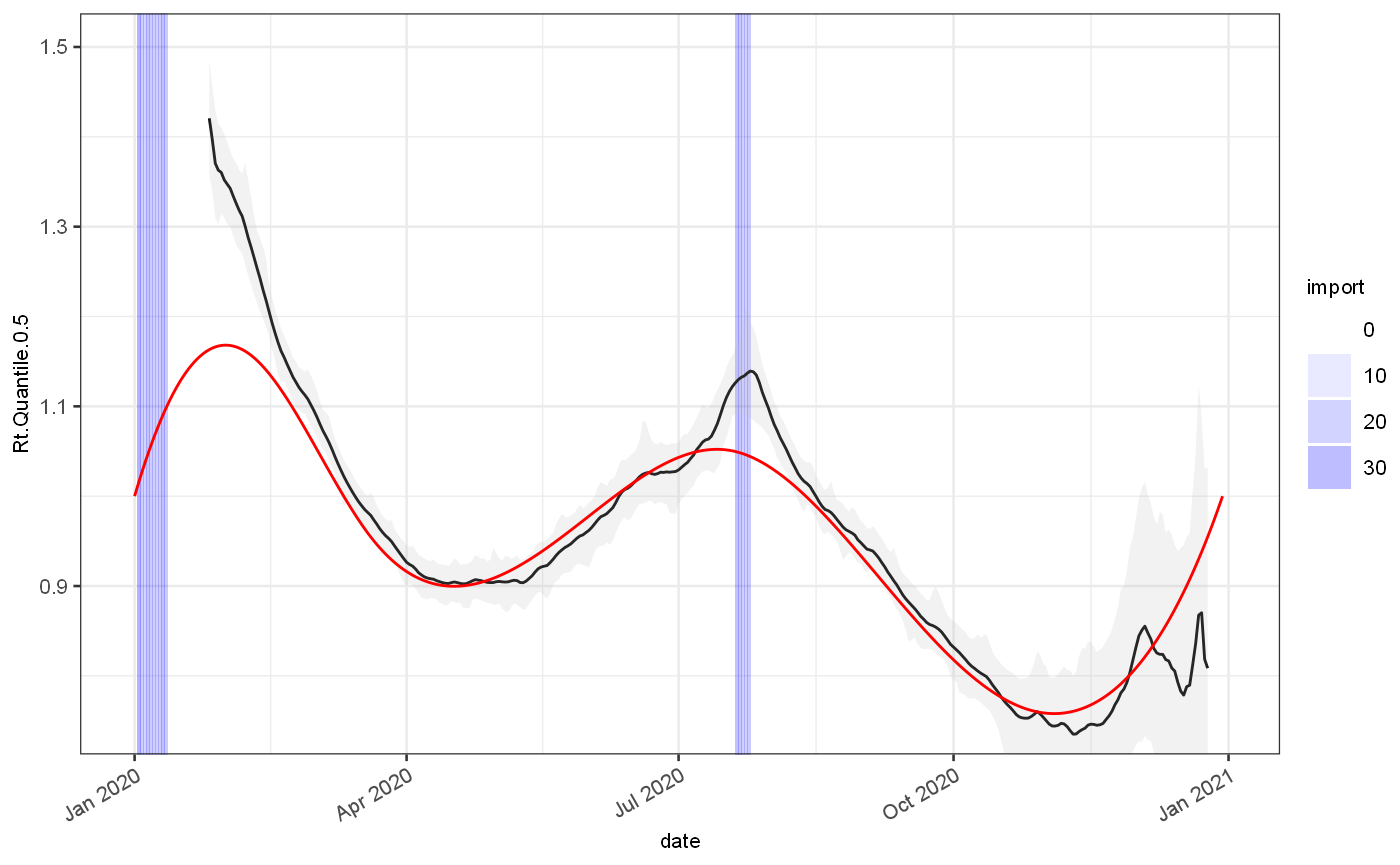
ggplot(out)+
  geom_rect(data=test, mapping=aes(xmin=date,xmax=date+1,alpha=import),ymin=-Inf,ymax=Inf,fill="blue")+
  scale_alpha_continuous(range=c(0,0.3))+
  geom_line(aes(x=date,y=Rt.Quantile.0.5), colour="black")+
  geom_ribbon(aes(x=date,ymin=Rt.Quantile.0.025,ymax=Rt.Quantile.0.975), fill="grey",alpha=0.2)+
  geom_line(data=test, mapping=aes(x=date,y=Rt.actual), colour="red")+
  coord_cartesian(ylim=c(0.75,1.5))
## Warning: Removed 30 row(s) containing missing values (geom_path).
ggplot(out)+
  geom_rect(data=test, mapping=aes(xmin=date,xmax=date+1,alpha=import),ymin=-Inf,ymax=Inf,fill="blue")+
  scale_alpha_continuous(range=c(0,0.3))+
  geom_line(aes(x=date,y=Growth.Quantile.0.5), colour="black")+
  geom_ribbon(aes(x=date,ymin=Growth.Quantile.0.025,ymax=Growth.Quantile.0.975), fill="grey",alpha=0.2)+
  geom_line(data=test, mapping=aes(x=date,y=Growth.actual), colour="red")+
  coord_cartesian(ylim=c(-0.15,0.15))
## Warning: Removed 18 row(s) containing missing values (geom_path).
